Some computer scientists have used databases to demonstrate various methods of combinatorial computing with the characters in Hugo’s Les Misérables. I find their graphs of the novel’s characters and their encounters interesting visual tools for interpreting and teaching Hugo’s Les Misérables. As “data,” all characters have to be counted or “registered”, no matter how obscure or insignificant they are in the novel. The question is: does this network of relations that we can now visualize with graphs tell us something new about the characters and the novel?
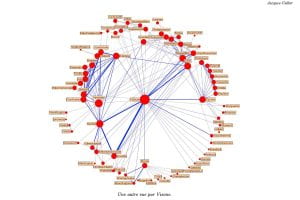
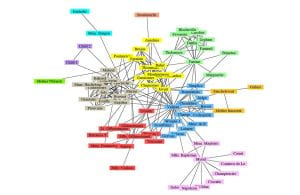
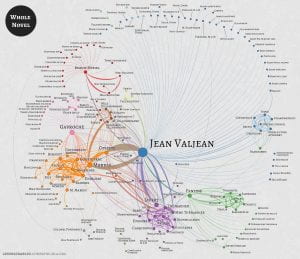
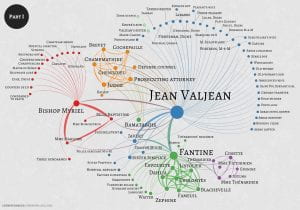
These graphs come from Jacques Cellier’s graphs produced by Pajek and Visone (using the Louvain algorithm) as well as M.E.J. Newman and M. Girvan, all based on the original data by computer scientist Donald E. Knuth (published in his seminal Stanford GraphBase: A Platform for Combinatorial Computing). Michal P. Ginsburg revised and expanded the database. His graphs, show the characters’ inter-relations by grouping them into “communities” or “clusters”; they also show the frequency with which characters interact: the more frequently two characters meet, the thicker the edge that connects them.
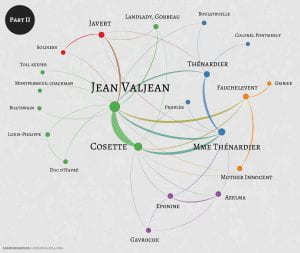
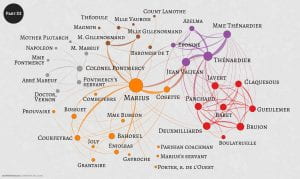
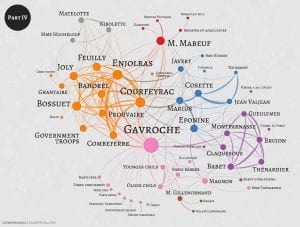
For more information on Michael Ginsburg’s work or for more information about each Les Misérables’ character and the characters he/she encounters, check the website Visualizing Les Misérables.